
















52% of stocks are above their 50-day average.
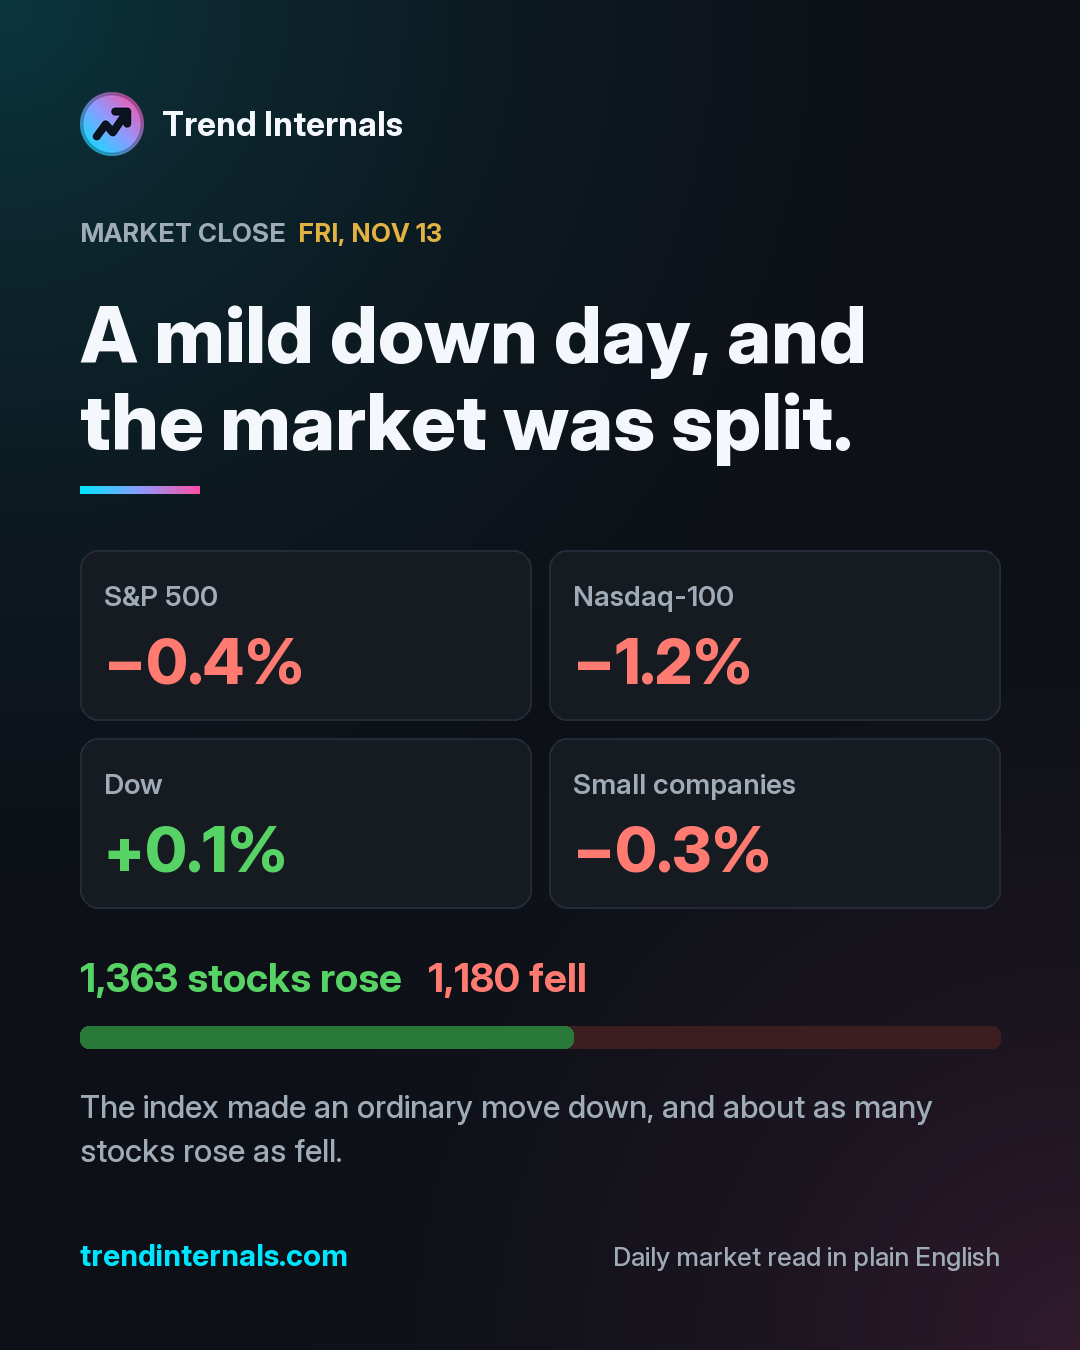
The market is split.
- Stocks above 50-day averagewas 48% a week ago52%
- Stocks up 4%+ in a day65
- Stocks down 4%+ in a day128
- S&P 500more than 1% below its 20-day high7,562
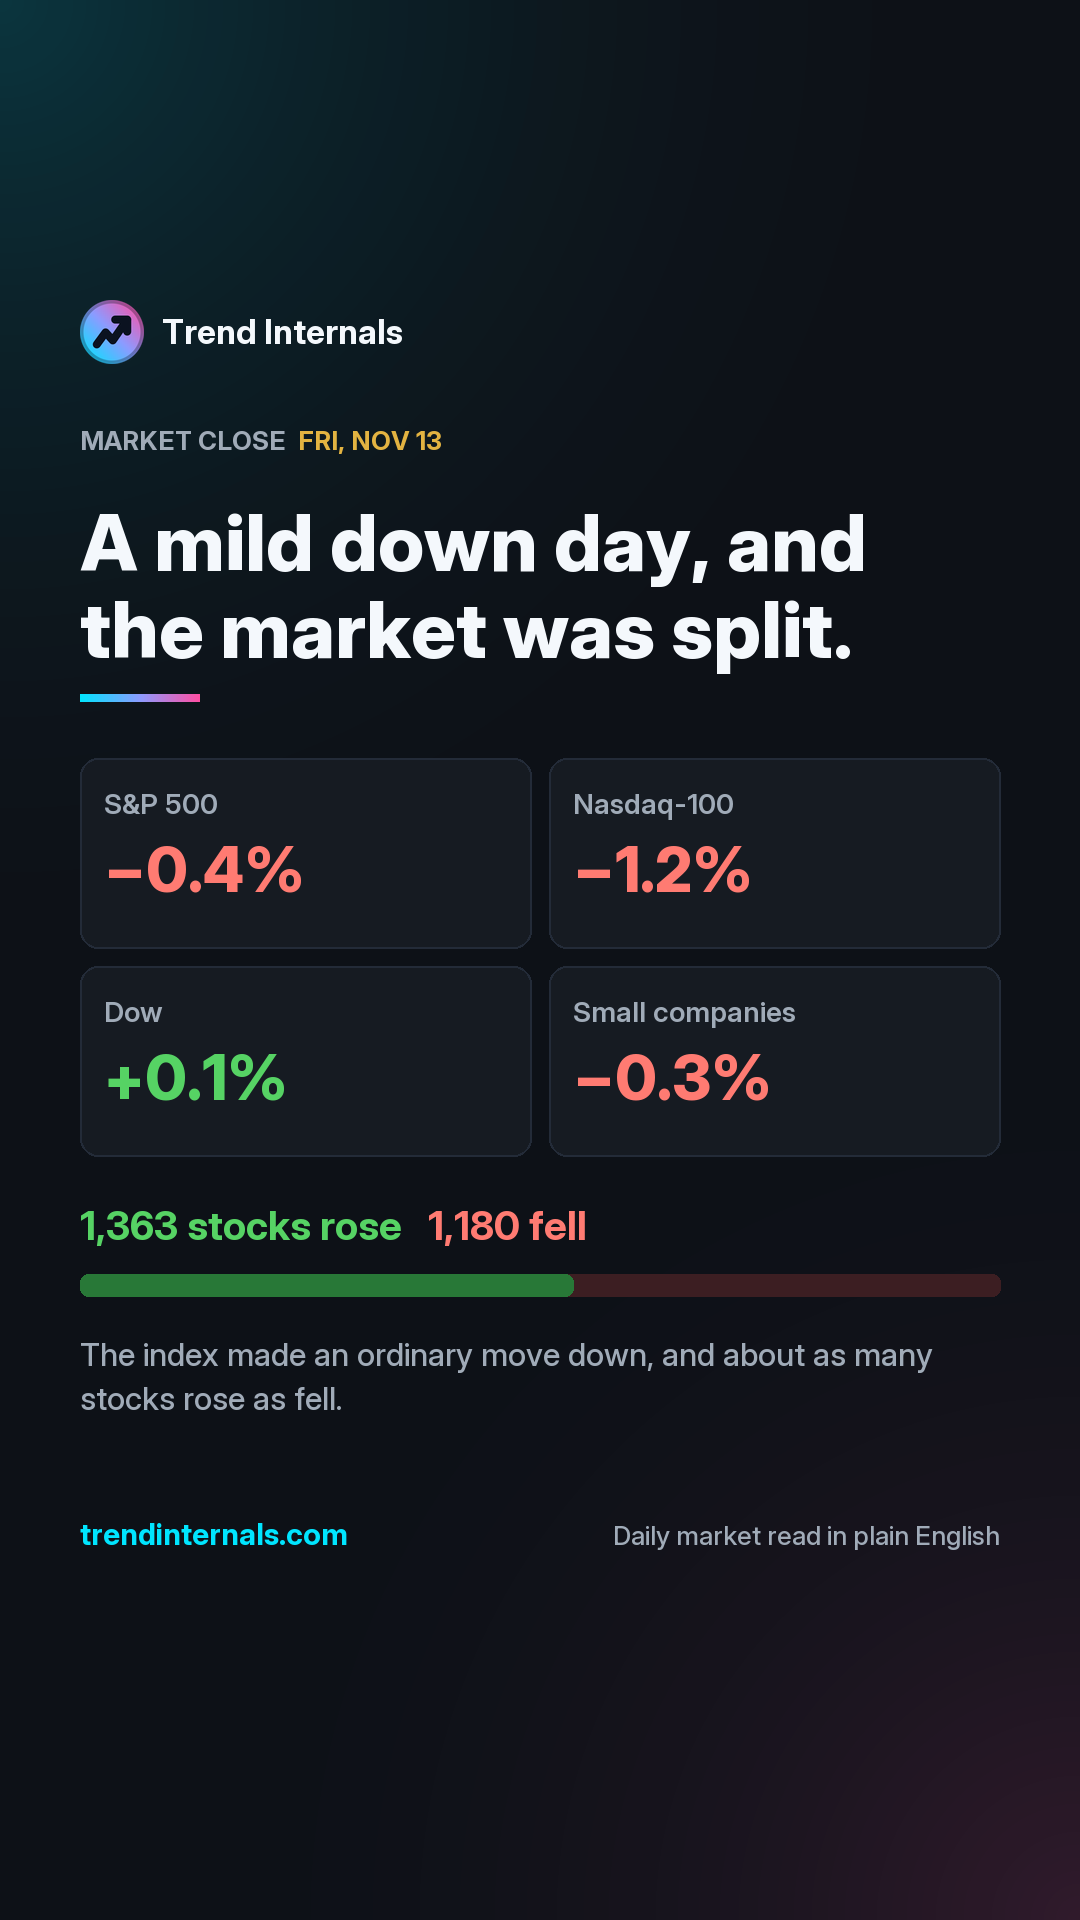
What it meansThe index made an ordinary move down, and about as many stocks rose as fell.
The mood combines two things: whether the S&P 500 rose, fell or barely moved, and whether more stocks rose than fell. When the two disagree, it reads Mixed. The two ends (Sharp selloff, Strong rally) need a big day: the S&P 500 up or down 0.75% or more and at least 65% of the stocks that moved on the same side.
Each move is the change from the previous close to the latest close. The Nasdaq-100, the Dow and small companies are measured through the QQQ, DIA and IWM funds. The small chart shows the past 20 trading days.
"Stocks" means the 2,573 US stocks we track: worth $800 million or more, with enough daily trading to matter. A stock above its 50-day average is in a short-term uptrend.
Sectors, strong stocks, market conditions, what changed and every hover card. Sign up in a few seconds, no card needed.
Few pressures are working against stocks right now. Hover or tap any row for the proof.
52% of stocks are above their 50-day average.
The market is split.